Micronaut Control Panel
The Micronaut Control Panel module provides a web UI that allows you to view and manage the state of your Micronaut application, typically in a development environment.
Version: 2.1.1-SNAPSHOT
1 Introduction
The Micronaut Control Panel module provides a web UI that allows you to view and manage the state of your Micronaut application, typically in a development environment.
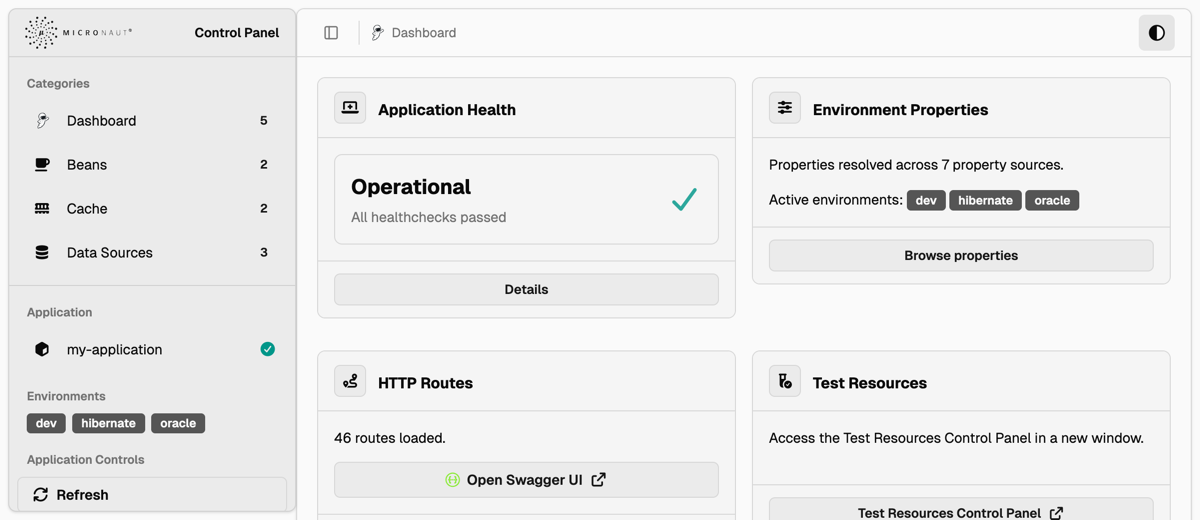
The bundled interface follows the shadcn/ui dashboard and component design language. It uses server-rendered Micronaut Views templates with local CSS and JavaScript assets, while matching shadcn/ui conventions for cards, buttons, badges, dialogs, data tables, tabs, breadcrumbs, sidebars, and light or dark color themes.
Figure 1. Light theme
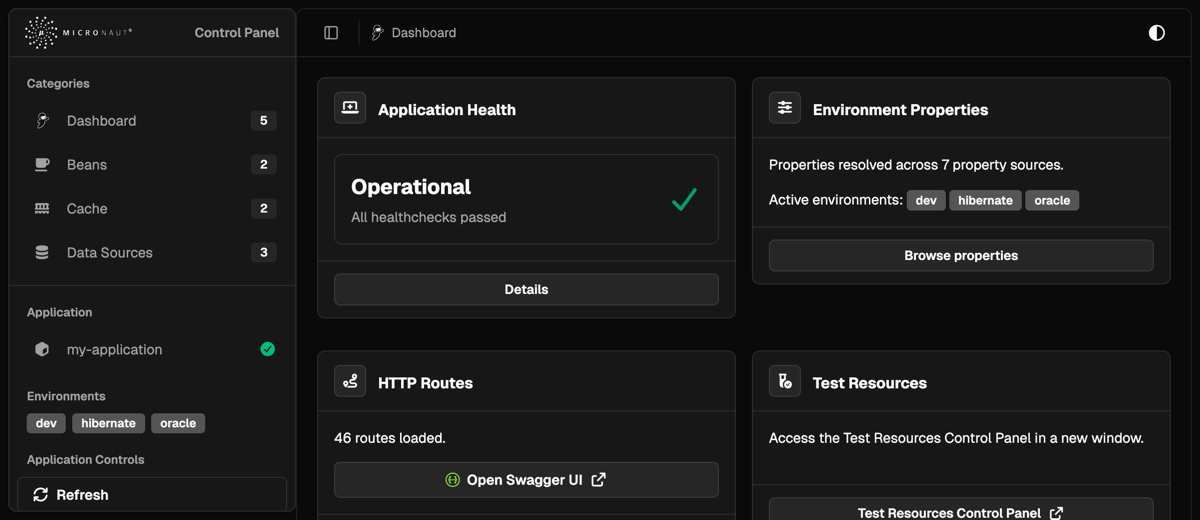
Figure 2. Dark theme
2 Release History
For this project, you can find a list of releases (with release notes) here:
3 Quick Start
To get started, add the UI module as a development-time dependency:
developmentOnly("io.micronaut.controlpanel:micronaut-control-panel-ui")<dependency>
<groupId>io.micronaut.controlpanel</groupId>
<artifactId>micronaut-control-panel-ui</artifactId>
<scope>provided</scope>
</dependency>Then, add the control panel modules that you want. For example, if you already have the
io.micronaut:micronaut-management module, you can add the micronaut-control-panel-management module:
developmentOnly("io.micronaut.controlpanel:micronaut-control-panel-management")<dependency>
<groupId>io.micronaut.controlpanel</groupId>
<artifactId>micronaut-control-panel-management</artifactId>
<scope>provided</scope>
</dependency>Some management panels require their backing Micronaut modules. For example, the Metrics panel appears only when Micrometer is present and metrics are enabled:
runtimeOnly("io.micronaut.micrometer:micronaut-micrometer-core")<dependency>
<groupId>io.micronaut.micrometer</groupId>
<artifactId>micronaut-micrometer-core</artifactId>
<scope>runtime</scope>
</dependency>By default, the Control Panel is only enabled in the dev or test environments. You can change this and other settings
in your configuration file:
| Property | Type | Description | Default value |
|---|---|---|---|
|
boolean |
Enables/disables the control panel module. Default value: "true". |
true |
|
java.util.Set |
Configures the environments where the control panel module is enabled. By default, it is only enabled in the "dev" and "test" environments. |
dev,test |
|
java.lang.String |
Configures the path where the control panel can be accessed. Default value: "/control-panel". |
/control-panel |
|
boolean |
Whether to print the Control Panel URL in the logs on application startup. Default: StringUtils.TRUE |
true |
Therefore, make sure you activate the appropriate environments when running locally, for example, using default environments:
# For Maven:
MICRONAUT_ENVIRONMENTS=dev ./mvnw mn:run

# For Gradle:
MICRONAUT_ENVIRONMENTS=dev ./gradlew run
Once the application is running, you can access the control panel at http://localhost:8080/control-panel.
4 Available Control Panels
All Control Panels are configurable with the following properties:
| Property | Type | Description | Default value |
|---|---|---|---|
|
boolean |
Sets whether this control panel is enabled or not. |
|
|
int |
Sets the order of this control panel, since they will be displayed sorted by order. |
|
|
java.lang.String |
Sets the title of this control panel. |
|
|
java.lang.String |
Sets the icon of this control panel. |
|
|
java.lang.String |
Sets the unique name of the control panel. Can be used in URLs. |
For example, to disable the routes control panel, set the property
micronaut.control-panel.panels.routes.enabled to false.
Beyond displaying the available panels, the control panel also allows you to perform two additional actions, provided
that the corresponding endpoints are enabled. These actions are routed through control-panel-owned helper routes, so
micronaut.control-panel.security.write-access applies to them independently of the raw management endpoint routes:
-
Refresh: refreshing the application will cause all
@Refreshablebeans in the context to be destroyed and re-instantiated upon further requests. This requires the Refresh Endpoint to be enabled. -
Stop: will shut down the application. This requires the Stop Endpoint to be enabled.
The raw /refresh and /stop management endpoint routes still follow Micronaut Management endpoint sensitivity rules.
Keep those raw routes sensitive unless you intentionally want callers outside the control panel to invoke them directly.
Micronaut Endpoints require having the io.micronaut:micronaut-management dependency on the classpath.
|
4.1 Built-in
The following control panels are available by default with the UI module:
-
routes: displays information about the available HTTP routes.
If an OpenAPI viewer is configured, the routes control panel displays a link to it. The panel checks for micronaut.router.static-resources.* mappings with the following keys:
-
swagger-ui -
redoc -
openapi-explorer -
scalar -
rapidoc
When one of those static resources is present, the panel extracts its URI (e.g. /swagger-ui/ or /swagger-ui/index.html) from the corresponding mapping and renders a button linking to the viewer.
4.2 Cache
The Cache control panel provides a web-based interface for managing caches in Micronaut applications supported by the Micronaut Cache module.
To add the Cache control panels, add the following dependency:
developmentOnly("io.micronaut.controlpanel:micronaut-control-panel-cache")<dependency>
<groupId>io.micronaut.controlpanel</groupId>
<artifactId>micronaut-control-panel-cache</artifactId>
<scope>provided</scope>
</dependency>This module automatically creates panels for each configured cache in your application. Each panel provides:
-
A count of cached objects (displayed as a badge)
-
Detailed cache information and configuration metadata
-
A table listing all cached key-value pairs
-
Cache management operations (invalidate individual keys or clear entire cache)
The control panel supports all cache implementations provided by Micronaut Cache:
-
Caffeine - High-performance Java caching library
-
Ehcache - Enterprise-grade caching solution
-
Hazelcast - Distributed caching with clustering capabilities
-
Infinispan - Distributed in-memory data grid
Cache Management Operations
Each cache panel includes interactive buttons to manage cache contents:
-
Invalidate all keys: Clears the entire cache by removing all stored entries
-
Invalidate: Removes individual cache entries by key
These operations are performed via REST endpoints and provide immediate feedback on success or failure.
Configuration
The cache control panel is automatically enabled when you include the micronaut-control-panel-cache module in your project. You can disable it by setting:
micronaut.control-panel.panels.cache.enabled=falsemicronaut:
control-panel:
panels:
cache:
enabled: falsemicronaut = {control-panel = {panels = {cache = {enabled = false}}}}micronaut {
controlPanel {
panels {
cache {
enabled = false
}
}
}
}{
micronaut {
control-panel {
panels {
cache {
enabled = false
}
}
}
}
}{
"micronaut": {
"control-panel": {
"panels": {
"cache": {
"enabled": false
}
}
}
}
}Individual cache panels can also be disabled by setting the cache-specific property:
micronaut.caches.my-cache.control-panel.enabled=falsemicronaut:
caches:
my-cache:
control-panel:
enabled: falsemicronaut = {caches = {my-cache = {control-panel = {enabled = false}}}}micronaut {
caches {
myCache {
controlPanel {
enabled = false
}
}
}
}{
micronaut {
caches {
my-cache {
control-panel {
enabled = false
}
}
}
}
}{
"micronaut": {
"caches": {
"my-cache": {
"control-panel": {
"enabled": false
}
}
}
}
}Cache Information Display
The detailed view of each cache shows:
-
Implementation Class: The underlying cache implementation
-
Cache Size: Current number of entries in the cache
-
Configuration Details: Implementation-specific settings (for Caffeine, Ehcache, Infinispan)
-
Cache Contents: Table of all key-value pairs currently stored
This provides complete visibility into your application’s caching layer for debugging and monitoring purposes.
4.3 Management
To add the management panels, include the following dependency:
developmentOnly("io.micronaut.controlpanel:micronaut-control-panel-management")<dependency>
<groupId>io.micronaut.controlpanel</groupId>
<artifactId>micronaut-control-panel-management</artifactId>
<scope>provided</scope>
</dependency>Note that you also need the Management module:
runtimeOnly("io.micronaut:micronaut-management")<dependency>
<groupId>io.micronaut</groupId>
<artifactId>micronaut-management</artifactId>
<scope>runtime</scope>
</dependency>The Metrics panel also needs Micrometer support:
runtimeOnly("io.micronaut.micrometer:micronaut-micrometer-core")<dependency>
<groupId>io.micronaut.micrometer</groupId>
<artifactId>micronaut-micrometer-core</artifactId>
<scope>runtime</scope>
</dependency>The following panels are available:
-
health: Application Health -
info: Application Info -
env: Environment Properties -
metrics: Metrics -
beans: Bean Definitions -
disabled-beans: Disabled Beans -
loggers: Logging Configuration
Protecting The Control Panel
When Micronaut Security is active, control panel routes are protected by default. The default access mode is
micronaut.control-panel.security.access=AUTHORIZED, which requires an authenticated user with
ROLE_CONTROL_PANEL.
If your application already uses Micronaut Security, the control panel does not become a separate OAuth client. Your existing Micronaut Security authentication mechanism authenticates the browser request, and the control panel fallback rule authorizes the UI and helper-controller routes.
The following example shows the default role-protected mode explicitly:
micronaut.security.enabled=true
micronaut.security.basic-auth.enabled=true
micronaut.control-panel.enabled=true
micronaut.control-panel.security.access=authorized
micronaut.control-panel.security.role=ROLE_CONTROL_PANEL
endpoints.env.enabled=true
endpoints.health.details-visible=AUTHENTICATED
endpoints.loggers.enabled=true
micronaut:
security:
enabled: true
basic-auth:
enabled: true
control-panel:
enabled: true
security:
access: authorized
role: ROLE_CONTROL_PANEL
endpoints:
env:
enabled: true
health:
details-visible: AUTHENTICATED
loggers:
enabled: truemicronaut = {security = {enabled = true, basic-auth = {enabled = true}}, control-panel = {enabled = true, security = {access = "authorized", role = "ROLE_CONTROL_PANEL"}}}
endpoints = {env = {enabled = true}, health = {details-visible = "AUTHENTICATED"}, loggers = {enabled = true}}micronaut {
security {
enabled = true
basicAuth {
enabled = true
}
}
controlPanel {
enabled = true
security {
access = "authorized"
role = "ROLE_CONTROL_PANEL"
}
}
}
endpoints {
env {
enabled = true
}
health {
detailsVisible = "AUTHENTICATED"
}
loggers {
enabled = true
}
}{
micronaut {
security {
enabled = true
basic-auth {
enabled = true
}
}
control-panel {
enabled = true
security {
access = "authorized"
role = "ROLE_CONTROL_PANEL"
}
}
}
endpoints {
env {
enabled = true
}
health {
details-visible = "AUTHENTICATED"
}
loggers {
enabled = true
}
}
}{
"micronaut": {
"security": {
"enabled": true,
"basic-auth": {
"enabled": true
}
},
"control-panel": {
"enabled": true,
"security": {
"access": "authorized",
"role": "ROLE_CONTROL_PANEL"
}
}
},
"endpoints": {
"env": {
"enabled": true
},
"health": {
"details-visible": "AUTHENTICATED"
},
"loggers": {
"enabled": true
}
}
}This secures the control panel routes themselves with
micronaut.control-panel.security.access=AUTHORIZED and
micronaut.control-panel.security.role=ROLE_CONTROL_PANEL. You can change the role if your application uses a
different administrative role:
micronaut.control-panel.security.role=ROLE_ADMINmicronaut:
control-panel:
security:
role: ROLE_ADMINmicronaut = {control-panel = {security = {role = "ROLE_ADMIN"}}}micronaut {
controlPanel {
security {
role = "ROLE_ADMIN"
}
}
}{
micronaut {
control-panel {
security {
role = "ROLE_ADMIN"
}
}
}
}{
"micronaut": {
"control-panel": {
"security": {
"role": "ROLE_ADMIN"
}
}
}
}Management endpoint security remains under the normal Micronaut management configuration for your application.
Control panel write operations inherit the read access decision by default. This preserves the existing behavior: a user who can open the control panel can also use write actions such as cache invalidation, object storage upload and delete, datasource SQL execution, logger reconfiguration, and Hibernate statistics or cache mutations.
You can disable all control-panel write operations while leaving read views available:
micronaut.control-panel.security.write-access=DENIEDmicronaut:
control-panel:
security:
write-access: DENIEDmicronaut = {control-panel = {security = {write-access = "DENIED"}}}micronaut {
controlPanel {
security {
writeAccess = "DENIED"
}
}
}{
micronaut {
control-panel {
security {
write-access = "DENIED"
}
}
}
}{
"micronaut": {
"control-panel": {
"security": {
"write-access": "DENIED"
}
}
}
}When writes are denied, write controls remain visible in the UI but are disabled with an explanatory reason. Direct HTTP calls to the control-panel helper routes are rejected by the server-side security rule.
You can also use separate read and write roles:
micronaut.control-panel.security.access=AUTHORIZED
micronaut.control-panel.security.role=ROLE_CONTROL_PANEL_READ
micronaut.control-panel.security.write-access=AUTHORIZED
micronaut.control-panel.security.write-role=ROLE_CONTROL_PANEL_WRITE
micronaut:
control-panel:
security:
access: AUTHORIZED
role: ROLE_CONTROL_PANEL_READ
write-access: AUTHORIZED
write-role: ROLE_CONTROL_PANEL_WRITEmicronaut = {control-panel = {security = {access = "AUTHORIZED", role = "ROLE_CONTROL_PANEL_READ", write-access = "AUTHORIZED", write-role = "ROLE_CONTROL_PANEL_WRITE"}}}micronaut {
controlPanel {
security {
access = "AUTHORIZED"
role = "ROLE_CONTROL_PANEL_READ"
writeAccess = "AUTHORIZED"
writeRole = "ROLE_CONTROL_PANEL_WRITE"
}
}
}{
micronaut {
control-panel {
security {
access = "AUTHORIZED"
role = "ROLE_CONTROL_PANEL_READ"
write-access = "AUTHORIZED"
write-role = "ROLE_CONTROL_PANEL_WRITE"
}
}
}
}{
"micronaut": {
"control-panel": {
"security": {
"access": "AUTHORIZED",
"role": "ROLE_CONTROL_PANEL_READ",
"write-access": "AUTHORIZED",
"write-role": "ROLE_CONTROL_PANEL_WRITE"
}
}
}
}If write-access: AUTHORIZED is configured without write-role, the configured read role is used as the effective
write role. The available write access modes are INHERITED, ANONYMOUS, AUTHENTICATED, AUTHORIZED, and DENIED.
The AUTHENTICATED mode requires any logged-in user, but does not require a specific role. The ANONYMOUS mode keeps
the UI and helper controllers anonymously reachable. Use these modes only for trusted development or test environments:
micronaut.control-panel.security.access=AUTHENTICATEDmicronaut:
control-panel:
security:
access: AUTHENTICATEDmicronaut = {control-panel = {security = {access = "AUTHENTICATED"}}}micronaut {
controlPanel {
security {
access = "AUTHENTICATED"
}
}
}{
micronaut {
control-panel {
security {
access = "AUTHENTICATED"
}
}
}
}{
"micronaut": {
"control-panel": {
"security": {
"access": "AUTHENTICATED"
}
}
}
}Host intercept-url-map rules run before the control-panel fallback rule, so host rules can still be stricter than the
configured control panel access mode.
Application Health
This panel displays the health information of your application, and relies on the
Health Endpoint to display its information. By default, the
health endpoint only displays details to authenticated users. When the control panel itself is protected by Micronaut
Security, the current authenticated request is reused and details-visible: AUTHENTICATED works as expected:
Make sure this is done in an environment-specific configuration file, for example, application-dev.yml.
|
Configuring authenticated-only health details for the control panel
endpoints.health.details-visible=AUTHENTICATEDendpoints:
health:
details-visible: AUTHENTICATEDendpoints = {health = {details-visible = "AUTHENTICATED"}}endpoints {
health {
detailsVisible = "AUTHENTICATED"
}
}{
endpoints {
health {
details-visible = "AUTHENTICATED"
}
}
}{
"endpoints": {
"health": {
"details-visible": "AUTHENTICATED"
}
}
}If you opt into micronaut.control-panel.security.access=ANONYMOUS, anonymous control-panel requests continue to see the
anonymous health view.
Application Info
This panel displays application information, and relies on the Info Endpoint to display its information. The panel appears when the Info endpoint is available and can be disabled independently:
Disabling the Application Info panel
micronaut.control-panel.panels.info.enabled=falsemicronaut:
control-panel:
panels:
info:
enabled: falsemicronaut = {control-panel = {panels = {info = {enabled = false}}}}micronaut {
controlPanel {
panels {
info {
enabled = false
}
}
}
}{
micronaut {
control-panel {
panels {
info {
enabled = false
}
}
}
}
}{
"micronaut": {
"control-panel": {
"panels": {
"info": {
"enabled": false
}
}
}
}
}The Info endpoint can expose configuration-backed info.* values, build and git metadata, and values from custom
InfoSource beans. Configure it only in environments where the Control Panel should be available:
Make sure this is done in an environment-specific configuration file, for example, application-dev.yml or
application-test.yml.
|
Configuring the Info Endpoint
endpoints.info.enabled=true
info.app.name=my-service
info.app.version=1.0.0
endpoints:
info:
enabled: true
info:
app:
name: my-service
version: 1.0.0endpoints = {info = {enabled = true}}
info = {app = {name = "my-service", version = "1.0.0"}}endpoints {
info {
enabled = true
}
}
info {
app {
name = "my-service"
version = "1.0.0"
}
}{
endpoints {
  info {
    enabled = true
  }
}
info {
  app {
    name = "my-service"
    version = "1.0.0"
  }
}
}{
"endpoints": {
"info": {
"enabled": true
}
},
"info": {
"app": {
"name": "my-service",
"version": "1.0.0"
}
}
}The panel renders nested maps and lists from info.*, git/build property files, and custom InfoSource output.
Environment Properties
This panel displays all the configuration properties resolved, and relies on the Environment Endpoint to display all the properties. This endpoint is disabled by default, so you need to configure it to be enabled in the environments where the control panel is enabled:
Make sure this is done in an environment-specific configuration file, for example, application-dev.yml.
|
Configuring the Environment Endpoint
endpoints.env.enabled=trueendpoints:
env:
enabled: trueendpoints = {env = {enabled = true}}endpoints {
env {
enabled = true
}
}{
endpoints {
  env {
    enabled = true
  }
}
}{
"endpoints": {
"env": {
"enabled": true
}
}
}Also, by default, all the values will be masked. If you want to see the actual configuration values in the control panel, you can enable the built-in filter by setting the following configuration property:
Displaying the actual configuration values
micronaut.control-panel.env.show-values=truemicronaut:
control-panel:
env:
show-values: truemicronaut = {control-panel = {env = {show-values = true}}}micronaut {
controlPanel {
env {
showValues = true
}
}
}{
micronaut {
control-panel {
env {
show-values = true
}
}
}
}{
"micronaut": {
"control-panel": {
"env": {
"show-values": true
}
}
}
}This will show all values apart from those that contain the words password, credential, certificate, key,
secret or token anywhere in their name.
Metrics
This panel displays a searchable, read-only view of Micrometer metrics. It relies on the Micronaut Micrometer module and the Metrics Endpoint bean. The panel appears only when Micrometer metrics are enabled and the Metrics endpoint is available.
The detail view shows the selected metric’s description, base unit, measurements, and available tags. Tag filtering uses
the same repeatable tag parameter shape as the Metrics endpoint, for example tag=outcome:success. Tag values that
contain additional : characters are preserved.
This panel is intended as a lightweight development-time inspector. It does not configure meter registries, expose exporters, mutate metrics, provide alerts, or replace production observability dashboards such as Grafana.
You can disable only this panel with:
Disabling the Metrics panel
micronaut.control-panel.panels.metrics.enabled=falsemicronaut:
control-panel:
panels:
metrics:
enabled: falsemicronaut = {control-panel = {panels = {metrics = {enabled = false}}}}micronaut {
controlPanel {
panels {
metrics {
enabled = false
}
}
}
}{
micronaut {
control-panel {
panels {
metrics {
enabled = false
}
}
}
}
}{
"micronaut": {
"control-panel": {
"panels": {
"metrics": {
"enabled": false
}
}
}
}
}Bean Definitions
This panel displays all the beans, and their relationships, grouped by packages. It relies on the Beans Endpoint to display all the bean definitions. Keep the role-protected control-panel access when you do not want to expose that information to anonymous users.
Disabled Beans
This panel shows all disabled beans, i.e., beans that have not met any of their requirement conditions. For each disabled bean, you can see the reasons why the bean was not loaded.
Logging Configuration
This panel allows you to view and re-configure the logging levels without restarting the application. It relies on the Loggers Endpoint to display the logging levels. The control panel updates logger levels through a control-panel route, so the raw management endpoint can keep its default write sensitivity when you only need writes from the control panel. The endpoint is disabled by default, so enable it in the environments where the control panel should manage logging:
Make sure this is done in an environment-specific configuration file, for example, application-dev.yml.
|
Configuring the Loggers Endpoint
endpoints.loggers.enabled=trueendpoints:
loggers:
enabled: trueendpoints = {loggers = {enabled = true}}endpoints {
loggers {
enabled = true
}
}{
endpoints {
  loggers {
    enabled = true
  }
}
}{
"endpoints": {
"loggers": {
"enabled": true
}
}
}When Micronaut Security is active and micronaut.control-panel.security.access=AUTHORIZED, only users with the
configured control-panel role can re-configure loggers through the control panel. Direct HTTP calls to
/loggers/{logger} still follow Micronaut Management endpoint sensitivity rules. Set
endpoints.loggers.write-sensitive=false only when you intentionally want to expose direct writable management endpoint
access outside the control panel.
4.4 Object Storage
The Object Storage control panel provides a web-based interface for managing files stored in various object storage systems supported by the Micronaut Object Storage module.
Assuming you already have one or more Micronaut Object Storage dependencies, to add the Object Storage panels, add the following dependency:
developmentOnly("io.micronaut.controlpanel:micronaut-control-panel-object-storage")<dependency>
<groupId>io.micronaut.controlpanel</groupId>
<artifactId>micronaut-control-panel-object-storage</artifactId>
<scope>provided</scope>
</dependency>This module automatically creates panels for each configured object storage system in your application. Each panel provides:
-
A count of stored objects (displayed as a badge)
-
Detailed metadata about the storage configuration
-
A table listing all stored objects with their content types
-
File management operations (download, upload, delete)
The control panel supports all object storage systems provided by Micronaut Object Storage:
-
Local Storage - Files stored on the local filesystem
-
Amazon S3 - AWS Simple Storage Service
-
Azure Blob Storage - Microsoft Azure Blob Storage
-
Google Cloud Storage - Google Cloud Platform
-
Oracle Cloud Storage - Oracle Cloud Infrastructure
The control panel is automatically enabled when you include the micronaut-control-panel-object-storage module in your project. You can disable it by setting:
micronaut.control-panel.panels.object-storage.enabled=falsemicronaut:
control-panel:
panels:
object-storage:
enabled: falsemicronaut = {control-panel = {panels = {object-storage = {enabled = false}}}}micronaut {
controlPanel {
panels {
objectStorage {
enabled = false
}
}
}
}{
micronaut {
control-panel {
panels {
object-storage {
enabled = false
}
}
}
}
}{
"micronaut": {
"control-panel": {
"panels": {
"object-storage": {
"enabled": false
}
}
}
}
}4.5 Datasource
The Datasource Control Panel provides a view into your application databases:
Features include:
-
Database schema discovery with connection, database, and driver details grouped on the datasource card.
-
A table browser that loads tables page by page, with schema and name filters.
-
Table detail for columns, keys, relationships, and a focused E/R diagram.
-
SQL console with schema autocompletion, client-side SQL linting, and paginated query results.
-
JSON display actions for supported databases.
-
Optional connection pool status and options for supported pool implementations.
Browsing Tables
The Tables tab lists tables without rendering the full datasource schema at once. Use the schema filter and table search field to narrow the current page, then click a table row to open its detail panel.
The table detail panel shows the selected table name and schema, columns, primary keys, foreign keys, unique keys, relationship links, and an E/R diagram for the selected table. Relationship links open the related table detail so you can move through the schema without returning to the datasource list.
The table list and detail panel are separated by a resizable divider. The detail panel can also be collapsed from the table detail icon when you need more room for the table list.
SQL and JSON Results
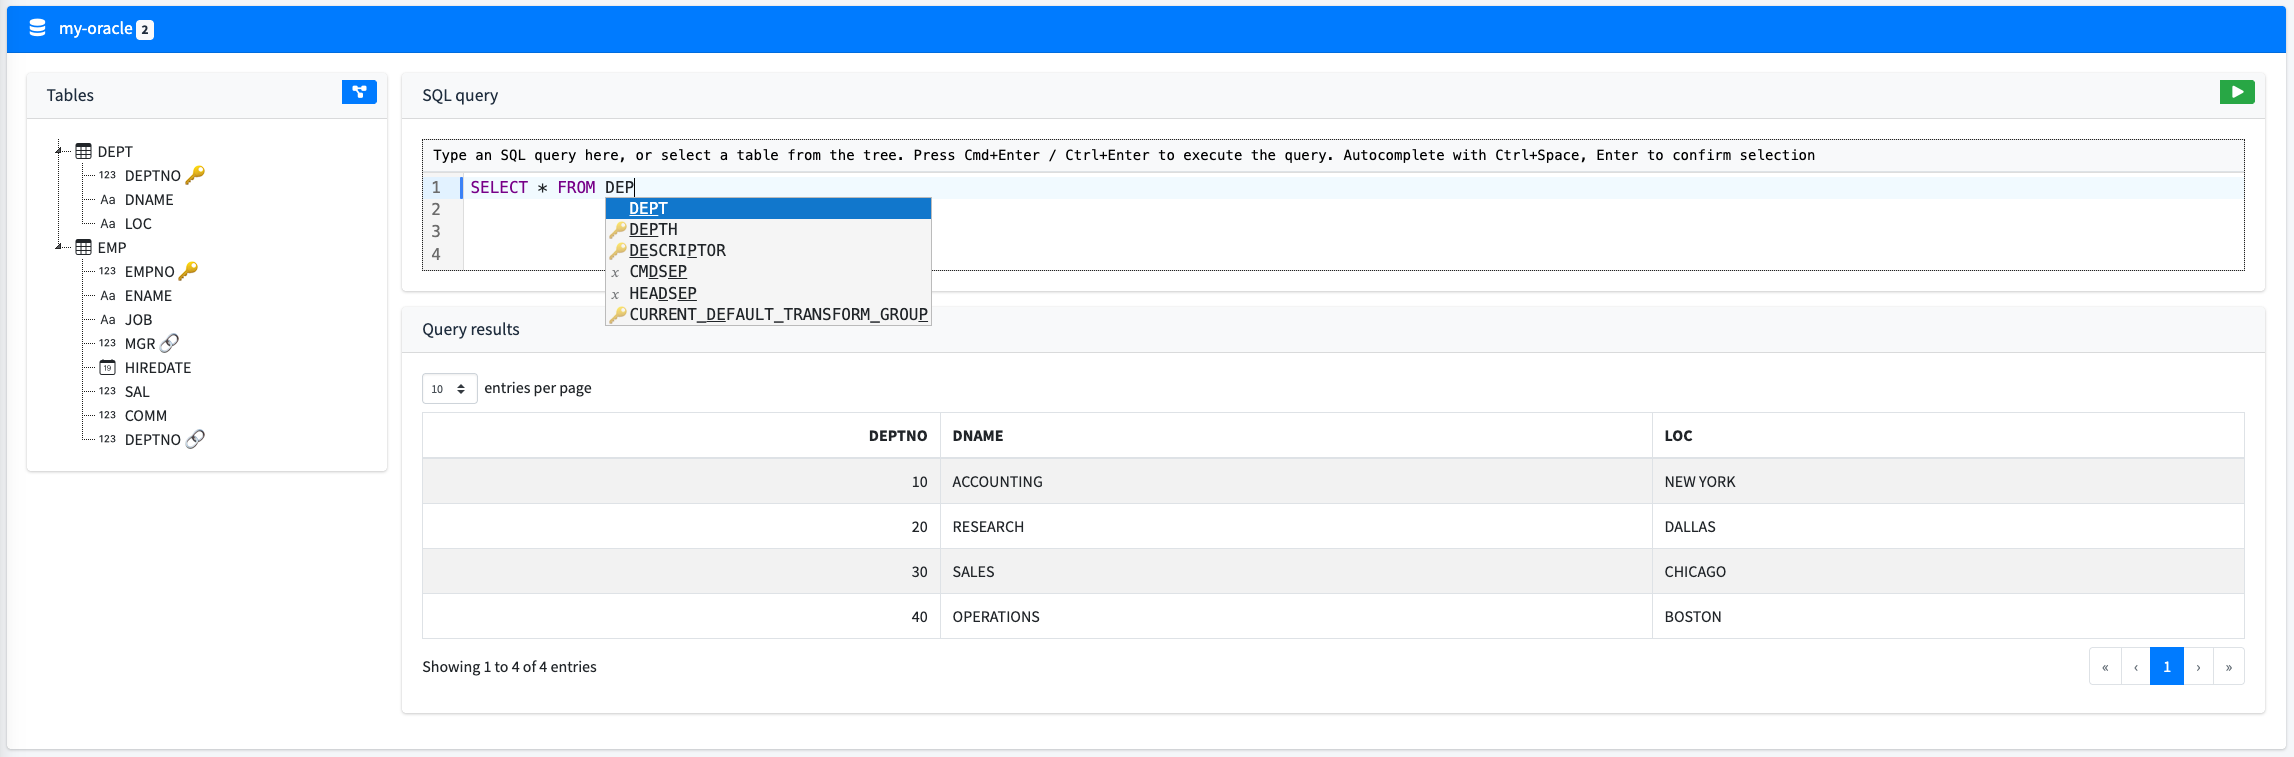
The SQL console can execute ad hoc queries and displays the result set in a paginated table:
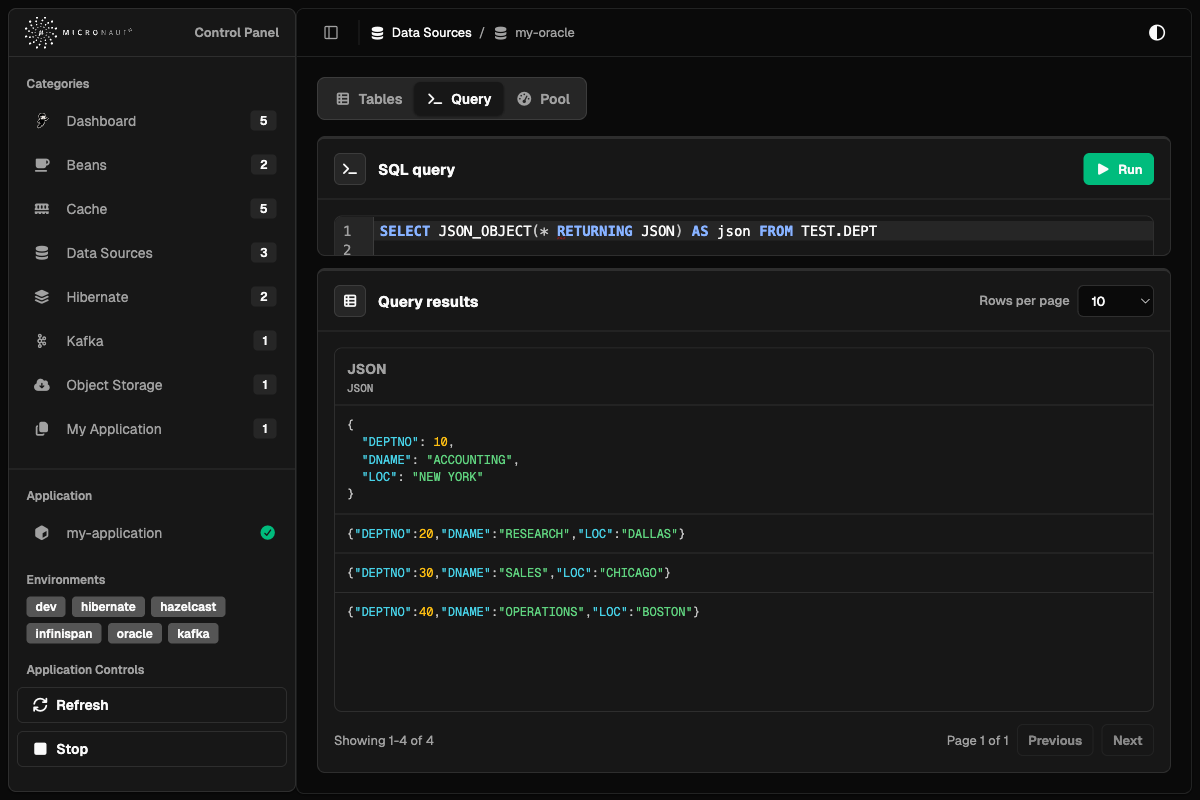
Figure 1. Datasource SQL query browser
Table actions can insert a SELECT * query or a database-specific JSON query for the selected table. PostgreSQL datasources use to_json/to_jsonb queries, and Oracle datasources use JSON_OBJECT(… RETURNING JSON) so the returned column metadata identifies JSON values.
When a query result column is JSON, the cell is highlighted as JSON. Click the cell to format the JSON in place; click it again to return to the compact value. Non-JSON columns continue to render as regular table cells.
If the selected table has relationships, the table actions also include a JSON-with-relationships query. The generated JSON contains all table properties plus relationship properties named after the foreign key or relationship name.
Connection Pools
When a supported pool implementation is present on the classpath and the datasource uses that pool, the datasource detail includes a Pool tab:
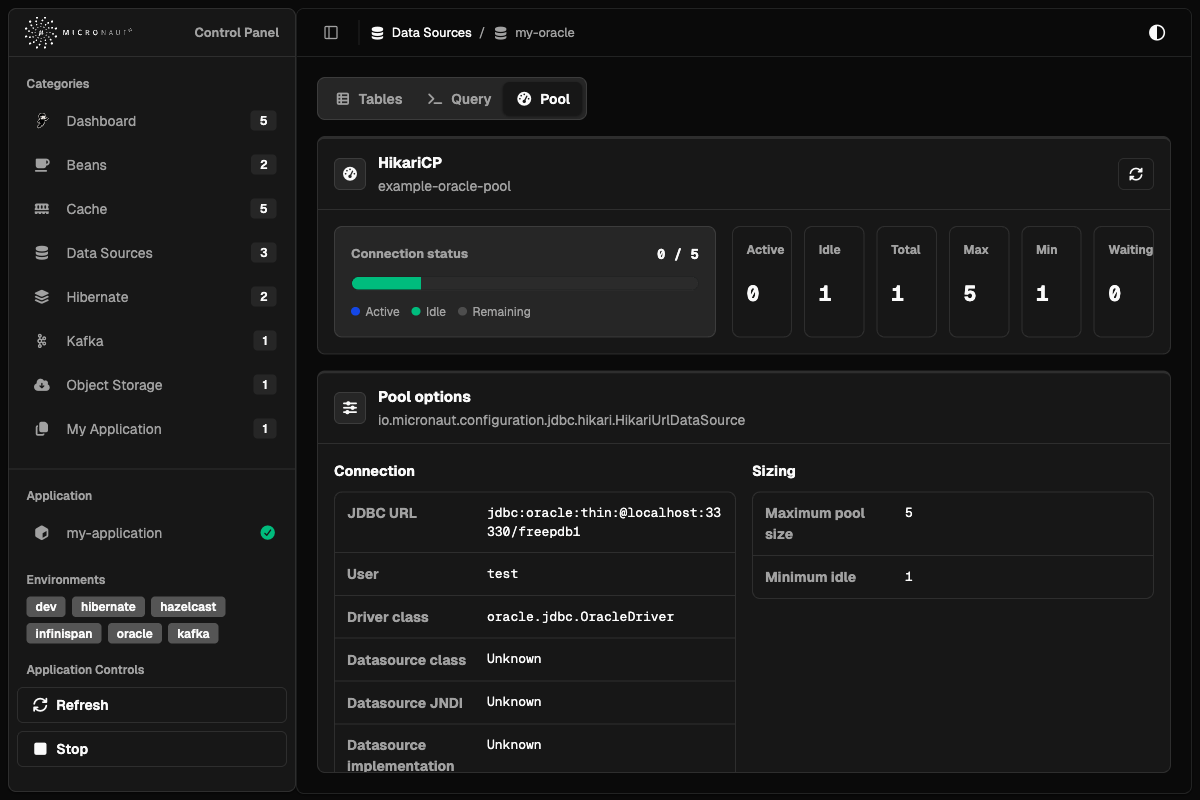
Figure 2. Datasource connection pool details
The pool tab shows a refreshable connection status card with active, idle, remaining, total, min, max, and waiting connection counts. It also lists pool options such as JDBC URL, user, sizing, timeouts, validation SQL, and behavior flags.
HikariCP pools are detected when micronaut-jdbc-hikari/HikariCP is present. Oracle UCP pools are detected when micronaut-jdbc-ucp/Oracle UCP is present. The tab is omitted when no supported pool inspector is available for the datasource.
To get started, add the following module as a development-time dependency:
developmentOnly("io.micronaut.controlpanel:micronaut-control-panel-datasource")<dependency>
<groupId>io.micronaut.controlpanel</groupId>
<artifactId>micronaut-control-panel-datasource</artifactId>
<scope>provided</scope>
</dependency>It is assumed that you already have datasources configured with either micronaut-sql or micronaut-data. If not, you can check the following documentation:
Configuration
The datasource control panel is automatically enabled when you include the micronaut-control-panel-datasource module in your project.
You can disable it by setting:
micronaut.control-panel.panels.datasource.enabled=falsemicronaut:
control-panel:
panels:
datasource:
enabled: falsemicronaut = {control-panel = {panels = {datasource = {enabled = false}}}}micronaut {
controlPanel {
panels {
datasource {
enabled = false
}
}
}
}{
micronaut {
control-panel {
panels {
datasource {
enabled = false
}
}
}
}
}{
"micronaut": {
"control-panel": {
"panels": {
"datasource": {
"enabled": false
}
}
}
}
}4.6 Hibernate
The Hibernate Control Panel provides a runtime view into Hibernate ORM session factories in Micronaut applications. It is intended for development-time inspection of session configuration, mapped entity metadata, datasource information, Hibernate statistics, cache regions, named queries, and read-only HQL query results.
To add the Hibernate control panels, add the following dependency:
developmentOnly("io.micronaut.controlpanel:micronaut-control-panel-hibernate")<dependency>
<groupId>io.micronaut.controlpanel</groupId>
<artifactId>micronaut-control-panel-hibernate</artifactId>
<scope>provided</scope>
</dependency>This module automatically creates a panel for each configured org.hibernate.SessionFactory. The category page lists the
available session factories and summarizes how many entity types and collection roles are mapped by each one.
Each detail page is organized into tabs:
-
Session details
-
JDBC Data Source
-
Entity types
-
Named queries
-
HQL Console
-
Statistics
-
Cache
Detail View
The detail view keeps static metadata separate from runtime counters and operational actions.
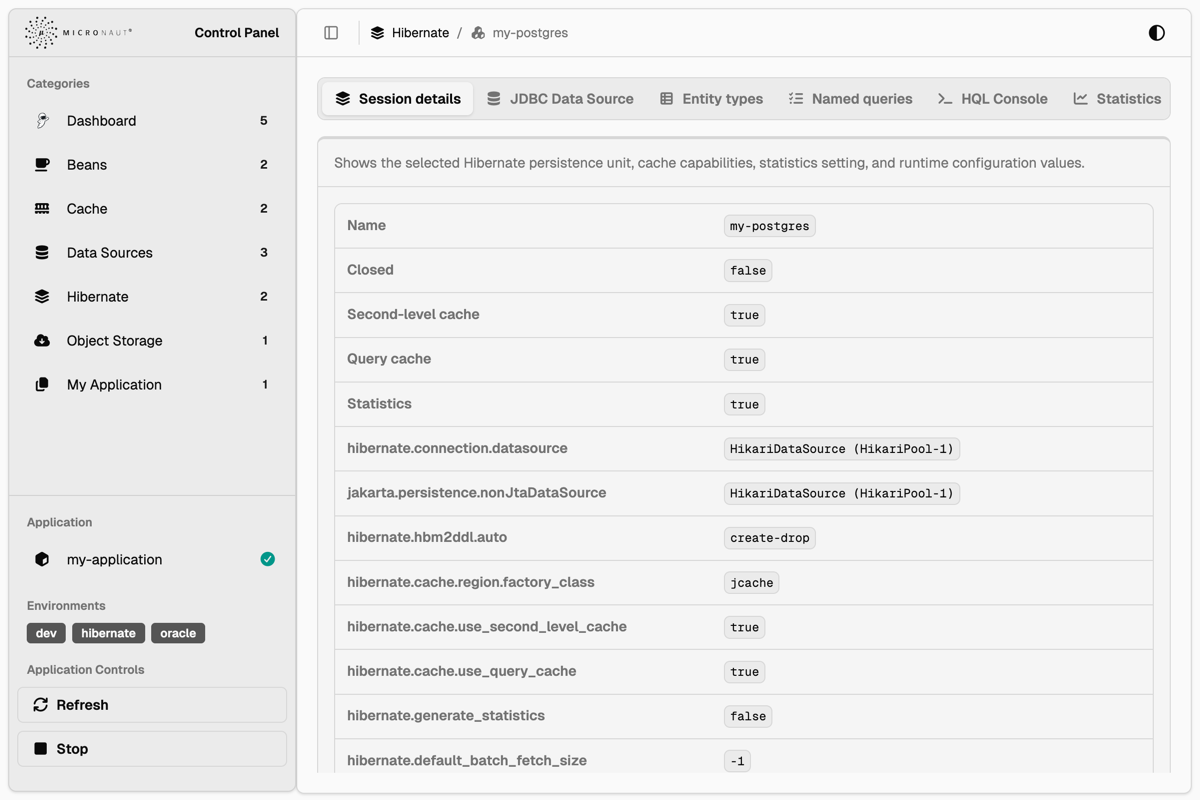
Figure 1. Hibernate session details
The Session details tab shows the selected persistence unit and a curated set of safe runtime configuration values. This
includes the session factory name, the datasource name, whether statistics are enabled, cache capabilities, default
catalog and schema, JDBC behavior, fetch settings, batch settings, query settings, transaction options, and selected
Hibernate properties. Sensitive values are masked when the property name contains password, credential,
certificate, key, secret, or token, matching the same legacy masking terms used by the Environment panel when
plain values are enabled.
The JDBC Data Source tab shows the datasource that backs the selected session factory. It includes connection metadata such as the bean name, JDBC URL, username, driver, database product, schema or catalog values, transaction isolation, autocommit, read-only state, and driver capability flags. This information is static datasource metadata and does not require Hibernate statistics to be enabled.
Entity Types
The Entity types tab shows mapped entity classes and persistent collection roles.
The entity table includes the Hibernate entity name, Java type, identifier type, attribute count, cache region, and runtime load/update counters when statistics are enabled. The attribute count opens a hover card with the mapped property names, Java types, mapping kind, and association or collection flags. The Properties action opens a dialog with all property definitions for the selected entity.
Entity and collection rows include an Actions menu. The Query action opens the HQL Console with a generated query for the selected entity type or collection role. The Evict action opens a confirmation dialog before removing matching entries from the second-level cache. Entity and collection eviction only removes cached Hibernate data; it does not delete database rows or related entities.
Named Queries
The Named queries tab lists named HQL and native SQL queries discovered from the selected session factory. The table shows the query name, query type, query text, cacheable flag, cache region, and available actions. Native SQL queries are identified separately from HQL so the original SQL text remains visible in the UI.
Named query actions can open the HQL Console for supported HQL queries. Native SQL entries are displayed for inspection, but the HQL Console remains a Hibernate query console and does not execute arbitrary SQL.
HQL Console
The HQL Console executes read-only Hibernate queries against the selected session factory. It is useful for checking entity mappings and inspecting a small result set without leaving the control panel.
The console displays scalar results in a table with generated column names. When a result value is a Hibernate entity, the cell displays the entity type and identifier, and a hover card shows the loaded property values. Paginated navigation is available when more results exist.
Mutation statements are rejected by the control panel. Use the Datasource Control Panel SQL console when you need to inspect JDBC tables directly.
Statistics
The Statistics tab contains the statistics switch and the runtime views that depend on Hibernate statistics. When statistics are disabled, the panel still shows static session details, datasource metadata, entity mappings, named queries, and cache regions, but runtime counters and query statistics are empty until statistics collection is enabled.
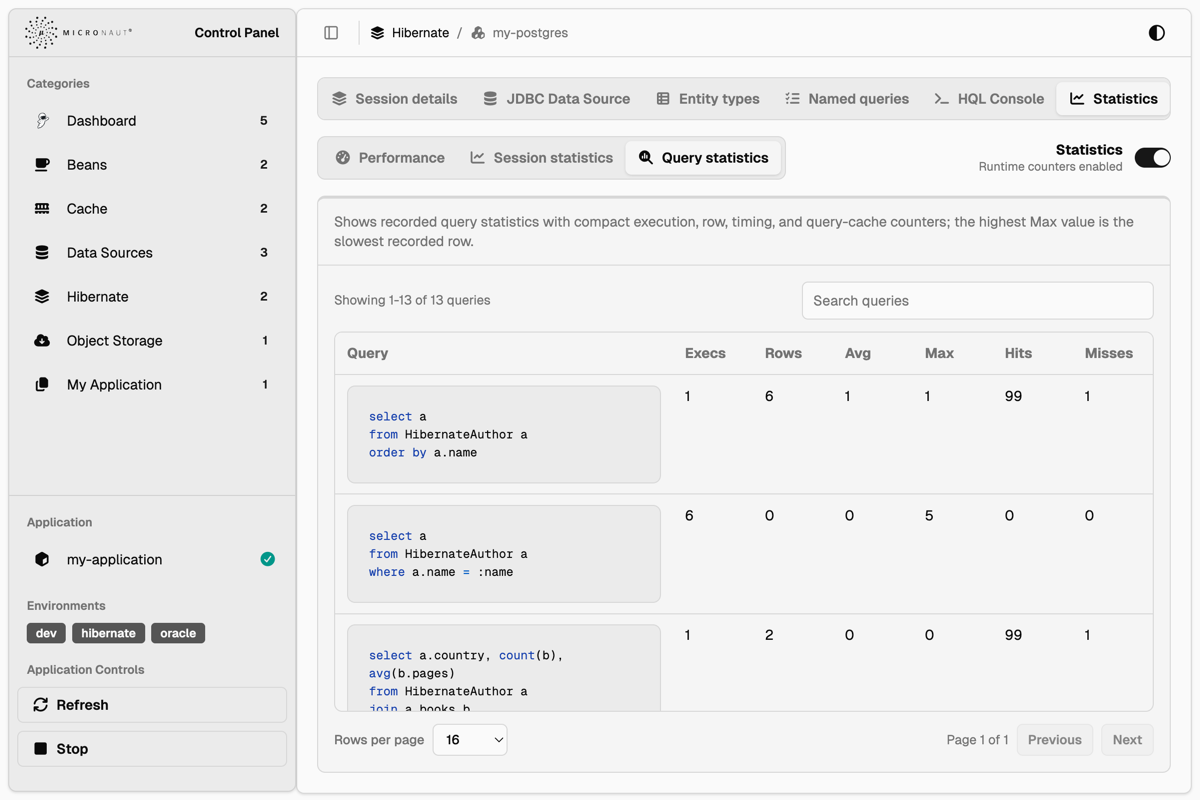
Figure 2. Hibernate query statistics
Statistics are split into nested tabs:
-
Performance shows a compact set of counters to check first, including query volume, slowest query time, entity loads and fetches, query cache hits and misses, second-level cache hits and misses, connection usage, prepared statements, and flushes.
-
Session statistics shows a searchable data table of Hibernate
Statisticscounters for the selected session factory. -
Query statistics shows a searchable and paginated data table of recorded query statistics. Query text is highlighted when possible, and the slowest recorded query is shown as a compact note above the table.
The Clear statistics action resets the accumulated statistics for the selected session factory after confirmation.
Cache
The Cache tab shows Hibernate second-level and query cache regions. The region list is visible even when statistics are disabled, so cache eviction is still available without enabling statistics.
When statistics are enabled, the cache tab also displays cache counters and provider-reported memory information. The summary cards split provider-reported element count and memory size into separate views. Some cache providers do not support extended region statistics; when Hibernate reports that extended statistics are unavailable, the panel displays the metric as unsupported instead of showing a misleading value.
Cache actions always use a confirmation dialog. The available actions include:
-
Evict all second-level cache regions.
-
Evict a specific cache region.
-
Evict cached entity data.
-
Evict cached collection data.
-
Evict the default query cache region.
-
Evict all query cache regions.
Cache eviction affects Hibernate cache entries only. It does not remove database rows.
Runtime Operations
The detail view exposes the following runtime operations:
-
Enable or disable Hibernate statistics collection.
-
Clear accumulated Hibernate statistics.
-
Evict all second-level cache regions.
-
Evict a specific cache region.
-
Evict cached entity or collection data.
-
Evict the default query cache region or all query cache regions.
-
Open generated HQL queries for mapped entities and collection roles.
-
Inspect all property definitions for a mapped entity.
Configuration
The Hibernate control panel is automatically enabled when you include the micronaut-control-panel-hibernate module in your project.
You can disable it by setting:
micronaut.control-panel.panels.hibernate.enabled=falsemicronaut:
control-panel:
panels:
hibernate:
enabled: falsemicronaut = {control-panel = {panels = {hibernate = {enabled = false}}}}micronaut {
controlPanel {
panels {
hibernate {
enabled = false
}
}
}
}{
micronaut {
control-panel {
panels {
hibernate {
enabled = false
}
}
}
}
}{
"micronaut": {
"control-panel": {
"panels": {
"hibernate": {
"enabled": false
}
}
}
}
}4.7 Kafka
The Kafka Control Panel provides Kafka cluster inspection, Kafka Streams topology visualization, optional Kafka ecosystem integration views, and default-off Kafka management actions for development-time diagnostics.
To get started, add the following module as a development-time dependency:
developmentOnly("io.micronaut.controlpanel:micronaut-control-panel-kafka")<dependency>
<groupId>io.micronaut.controlpanel</groupId>
<artifactId>micronaut-control-panel-kafka</artifactId>
<scope>provided</scope>
</dependency>Kafka Cluster
The Kafka Cluster panel is available when a Kafka AdminClient bean is configured by Micronaut Kafka.
Read views use Kafka AdminClient metadata APIs and temporary non-committing consumers for message browsing.
Features include:
-
View cluster id, controller broker, broker count, topic count, partition count, and consumer group count.
-
Navigate the Kafka Cluster detail page by section tabs for overview, cluster configuration, brokers, topics, consumer groups, messages, app consumers, writes/management, Schema Registry, Kafka Connect, and ksqlDB. Optional integration tabs are hidden until their endpoints are configured.
-
Page and search the safe cluster configuration summary.
-
Inspect brokers, host/port/rack metadata, controller status, leader/replica partition counts, under-replicated partition indicators, and broker configuration in a paginated modal.
-
Search and page topics, optionally showing internal topics.
-
View topic cleanup policy, retention settings, segment settings, and open topic partition details in a modal with leaders, replicas, ISR, beginning/end offsets, and paginated topic configuration.
-
Inspect consumer groups, state, protocol, member count, assigned partitions, committed partitions, total lag, member client id/host/assignment, and per-partition committed offset, end offset, and lag.
-
Browse messages by selecting an available topic and partition from the beginning, latest bounded window, a specific offset, or a timestamp. The browser uses temporary consumers with auto-commit disabled and no consumer group id, caps requested record counts, and renders payloads as UTF-8, JSON, or base64 for binary data. JSON payload formatting follows the application’s configured
JsonMapper; setmicronaut.serde.jackson.pretty-print=trueto display formatted JSON. -
Inspect Micronaut Kafka application consumers from
ConsumerRegistry, including consumer ids, subscriptions, assignments, and pause state. -
Display readable section-level errors when Kafka metadata, broker, topic, or offset calls are unavailable or unauthorized.
Sensitive broker and topic configuration values are filtered. The panel removes values Kafka marks as sensitive and also filters obvious secret-bearing configuration names such as passwords, tokens, credentials, JAAS, SASL, keystore, and truststore entries.
Optional Integrations
Schema Registry, Kafka Connect, and ksqlDB tabs are available in the Kafka Cluster page without adding mandatory dependencies to applications that only use Kafka cluster or Kafka Streams views. Each integration tab is hidden until its base URL is configured. Schema Registry, Kafka Connect, and ksqlDB use control-panel integration URLs:
micronaut.control-panel.panels.kafka.integrations.schema-registry.url=http://localhost:8081
micronaut.control-panel.panels.kafka.integrations.connect.url=http://localhost:8083
micronaut.control-panel.panels.kafka.integrations.ksqldb.url=http://localhost:8088
micronaut:
control-panel:
panels:
kafka:
integrations:
schema-registry:
url: http://localhost:8081
connect:
url: http://localhost:8083
ksqldb:
url: http://localhost:8088micronaut = {control-panel = {panels = {kafka = {integrations = {schema-registry = {url = "http://localhost:8081"}, connect = {url = "http://localhost:8083"}, ksqldb = {url = "http://localhost:8088"}}}}}}micronaut {
controlPanel {
panels {
kafka {
integrations {
schemaRegistry {
url = "http://localhost:8081"
}
connect {
url = "http://localhost:8083"
}
ksqldb {
url = "http://localhost:8088"
}
}
}
}
}
}{
micronaut {
control-panel {
panels {
kafka {
integrations {
schema-registry {
url = "http://localhost:8081"
}
connect {
url = "http://localhost:8083"
}
ksqldb {
url = "http://localhost:8088"
}
}
}
}
}
}
}{
"micronaut": {
"control-panel": {
"panels": {
"kafka": {
"integrations": {
"schema-registry": {
"url": "http://localhost:8081"
},
"connect": {
"url": "http://localhost:8083"
},
"ksqldb": {
"url": "http://localhost:8088"
}
}
}
}
}
}
}When configured, the Schema Registry tab shows subjects, versions, schema text, compatibility, and schema references. The Kafka Connect tab shows connectors, tasks, status, and filtered connector configuration. The ksqlDB tab shows streams, tables, and queries. Sensitive Schema Registry, Kafka Connect, and ksqlDB values are filtered before rendering.
Write Safety
Kafka management actions are disabled by default. The UI hides unavailable management forms, and every mutating endpoint also validates the write gates on the server.
micronaut.control-panel.panels.kafka.writes.enabled=false
micronaut.control-panel.panels.kafka.writes.destructive-enabled=false
micronaut:
control-panel:
panels:
kafka:
writes:
enabled: false
destructive-enabled: falsemicronaut = {control-panel = {panels = {kafka = {writes = {enabled = false, destructive-enabled = false}}}}}micronaut {
controlPanel {
panels {
kafka {
writes {
enabled = false
destructiveEnabled = false
}
}
}
}
}{
micronaut {
control-panel {
panels {
kafka {
writes {
enabled = false
destructive-enabled = false
}
}
}
}
}
}{
"micronaut": {
"control-panel": {
"panels": {
"kafka": {
"writes": {
"enabled": false,
"destructive-enabled": false
}
}
}
}
}
}Set micronaut.control-panel.panels.kafka.writes.enabled=true only in trusted development environments.
Destructive operations, such as deleting topics, deleting Schema Registry subjects or versions, and deleting Kafka Connect connectors, additionally require micronaut.control-panel.panels.kafka.writes.destructive-enabled=true.
The write model includes:
-
Topic management: create topics, update topic configs, increase partitions, and delete topics only when destructive actions are enabled.
-
Message production: produce string or JSON test messages with optional key, headers, and partition by using an isolated management producer. Produced message values, keys, header count, header keys, and header values are bounded server-side before a producer record is created.
-
Consumer group operations: delete empty groups and reset offsets to earliest, latest, a specific offset, or a timestamp.
-
App consumer operations: pause and resume Micronaut consumers through
ConsumerRegistry. -
Schema Registry writes: register schemas, update compatibility, and delete subjects or versions behind the destructive gate.
-
Kafka Connect writes: pause, resume, restart, update connector config, restart tasks, and delete connectors behind the destructive gate.
Management actions return structured success or error responses. Preview/confirmation flows show the target and impact before applying changes; offset reset operations compute the target offsets before applying them.
Kafka Streams
The Kafka Streams panel provides a visual representation of your Kafka Streams topologies:
Features include:
-
Visualize the stream processing topology using Mermaid diagrams.
-
Open source and sink topic nodes in the Kafka Cluster topic detail modal when the Kafka Cluster panel is available.
-
View the number of sub-topologies as a badge.
-
View Kafka Streams runtime state when Micronaut Management exposes Kafka Streams health details.
-
Automatically generated from the configured
ConfiguredStreamBuilderbeans.
It is assumed that you already have Kafka Streams configured in your application. If not, you can check the following documentation:
Configuration
The Kafka Cluster and Kafka Streams control panels are automatically enabled when you include the micronaut-control-panel-kafka module in your project and the required Kafka beans are available.
You can disable either panel by setting:
micronaut.control-panel.panels.kafka-cluster.enabled=false
micronaut.control-panel.panels.kafka-streams.enabled=false
micronaut:
control-panel:
panels:
kafka-cluster:
enabled: false
kafka-streams:
enabled: falsemicronaut = {control-panel = {panels = {kafka-cluster = {enabled = false}, kafka-streams = {enabled = false}}}}micronaut {
controlPanel {
panels {
kafkaCluster {
enabled = false
}
kafkaStreams {
enabled = false
}
}
}
}{
micronaut {
control-panel {
panels {
kafka-cluster {
enabled = false
}
kafka-streams {
enabled = false
}
}
}
}
}{
"micronaut": {
"control-panel": {
"panels": {
"kafka-cluster": {
"enabled": false
},
"kafka-streams": {
"enabled": false
}
}
}
}
}Per-Action Write Toggles
After the top-level write gate is enabled, individual actions can still be disabled.
Per-action toggles default to enabled so micronaut.control-panel.panels.kafka.writes.enabled remains the primary safety switch.
micronaut.control-panel.panels.kafka.writes.enabled=true
micronaut.control-panel.panels.kafka.writes.destructive-enabled=false
micronaut.control-panel.panels.kafka.writes.max-message-value-bytes=1048576
micronaut.control-panel.panels.kafka.writes.max-message-key-bytes=1024
micronaut.control-panel.panels.kafka.writes.max-message-headers=20
micronaut.control-panel.panels.kafka.writes.max-message-header-key-bytes=256
micronaut.control-panel.panels.kafka.writes.max-message-header-value-bytes=4096
micronaut.control-panel.panels.kafka.writes.actions.create-topic=true
micronaut.control-panel.panels.kafka.writes.actions.update-topic-config=true
micronaut.control-panel.panels.kafka.writes.actions.increase-partitions=true
micronaut.control-panel.panels.kafka.writes.actions.delete-topic=false
micronaut.control-panel.panels.kafka.writes.actions.produce-message=true
micronaut.control-panel.panels.kafka.writes.actions.delete-consumer-group=false
micronaut.control-panel.panels.kafka.writes.actions.reset-consumer-group-offsets=true
micronaut.control-panel.panels.kafka.writes.actions.pause-app-consumer=true
micronaut.control-panel.panels.kafka.writes.actions.resume-app-consumer=true
micronaut.control-panel.panels.kafka.writes.actions.register-schema=true
micronaut.control-panel.panels.kafka.writes.actions.update-schema-compatibility=true
micronaut.control-panel.panels.kafka.writes.actions.delete-schema-subject=false
micronaut.control-panel.panels.kafka.writes.actions.delete-schema-version=false
micronaut.control-panel.panels.kafka.writes.actions.pause-connector=true
micronaut.control-panel.panels.kafka.writes.actions.resume-connector=true
micronaut.control-panel.panels.kafka.writes.actions.restart-connector=true
micronaut.control-panel.panels.kafka.writes.actions.restart-connector-task=true
micronaut.control-panel.panels.kafka.writes.actions.update-connector-config=true
micronaut.control-panel.panels.kafka.writes.actions.delete-connector=false
micronaut:
control-panel:
panels:
kafka:
writes:
enabled: true
destructive-enabled: false
max-message-value-bytes: 1048576
max-message-key-bytes: 1024
max-message-headers: 20
max-message-header-key-bytes: 256
max-message-header-value-bytes: 4096
actions:
create-topic: true
update-topic-config: true
increase-partitions: true
delete-topic: false
produce-message: true
delete-consumer-group: false
reset-consumer-group-offsets: true
pause-app-consumer: true
resume-app-consumer: true
register-schema: true
update-schema-compatibility: true
delete-schema-subject: false
delete-schema-version: false
pause-connector: true
resume-connector: true
restart-connector: true
restart-connector-task: true
update-connector-config: true
delete-connector: falsemicronaut = {control-panel = {panels = {kafka = {writes = {enabled = true, destructive-enabled = false, max-message-value-bytes = 1048576, max-message-key-bytes = 1024, max-message-headers = 20, max-message-header-key-bytes = 256, max-message-header-value-bytes = 4096, actions = {create-topic = true, update-topic-config = true, increase-partitions = true, delete-topic = false, produce-message = true, delete-consumer-group = false, reset-consumer-group-offsets = true, pause-app-consumer = true, resume-app-consumer = true, register-schema = true, update-schema-compatibility = true, delete-schema-subject = false, delete-schema-version = false, pause-connector = true, resume-connector = true, restart-connector = true, restart-connector-task = true, update-connector-config = true, delete-connector = false}}}}}}micronaut {
controlPanel {
panels {
kafka {
writes {
enabled = true
destructiveEnabled = false
maxMessageValueBytes = 1048576
maxMessageKeyBytes = 1024
maxMessageHeaders = 20
maxMessageHeaderKeyBytes = 256
maxMessageHeaderValueBytes = 4096
actions {
createTopic = true
updateTopicConfig = true
increasePartitions = true
deleteTopic = false
produceMessage = true
deleteConsumerGroup = false
resetConsumerGroupOffsets = true
pauseAppConsumer = true
resumeAppConsumer = true
registerSchema = true
updateSchemaCompatibility = true
deleteSchemaSubject = false
deleteSchemaVersion = false
pauseConnector = true
resumeConnector = true
restartConnector = true
restartConnectorTask = true
updateConnectorConfig = true
deleteConnector = false
}
}
}
}
}
}{
micronaut {
control-panel {
panels {
kafka {
writes {
enabled = true
destructive-enabled = false
max-message-value-bytes = 1048576
max-message-key-bytes = 1024
max-message-headers = 20
max-message-header-key-bytes = 256
max-message-header-value-bytes = 4096
actions {
create-topic = true
update-topic-config = true
increase-partitions = true
delete-topic = false
produce-message = true
delete-consumer-group = false
reset-consumer-group-offsets = true
pause-app-consumer = true
resume-app-consumer = true
register-schema = true
update-schema-compatibility = true
delete-schema-subject = false
delete-schema-version = false
pause-connector = true
resume-connector = true
restart-connector = true
restart-connector-task = true
update-connector-config = true
delete-connector = false
}
}
}
}
}
}
}{
"micronaut": {
"control-panel": {
"panels": {
"kafka": {
"writes": {
"enabled": true,
"destructive-enabled": false,
"max-message-value-bytes": 1048576,
"max-message-key-bytes": 1024,
"max-message-headers": 20,
"max-message-header-key-bytes": 256,
"max-message-header-value-bytes": 4096,
"actions": {
"create-topic": true,
"update-topic-config": true,
"increase-partitions": true,
"delete-topic": false,
"produce-message": true,
"delete-consumer-group": false,
"reset-consumer-group-offsets": true,
"pause-app-consumer": true,
"resume-app-consumer": true,
"register-schema": true,
"update-schema-compatibility": true,
"delete-schema-subject": false,
"delete-schema-version": false,
"pause-connector": true,
"resume-connector": true,
"restart-connector": true,
"restart-connector-task": true,
"update-connector-config": true,
"delete-connector": false
}
}
}
}
}
}
}Limitations
The Kafka Control Panel is a development-time tool, not a production Kafka administration product. Users who can access the Control Panel can see Kafka metadata such as cluster id, broker hosts, topic names, partition layout, offsets, consumer groups, and non-sensitive configuration values. Use the existing Control Panel security configuration to restrict access.
Message browsing is bounded and uses temporary consumers with enable.auto.commit=false.
It does not commit offsets and does not join an application consumer group.
Large or binary payloads are truncated or rendered as base64 for display.
Optional integrations use their configured HTTP endpoints from the application process. Configure only trusted endpoints and keep write actions disabled unless the development environment is intended for Kafka management.
Runtime State
The Kafka Streams panel always renders the topology from the configured ConfiguredStreamBuilder.
When Micronaut Management and the Micronaut Kafka Streams health indicator expose details to the current Control Panel request path, the detail page also shows runtime state for the matching Kafka Streams application.
The runtime section includes the health status, stream thread names and states, client IDs, producer client IDs, and active or standby task information when those values are present in the Health endpoint response.
Runtime state is optional.
If Health details are hidden, disabled, or unavailable, the Kafka Streams panel still renders the topology diagram and shows an unavailable runtime-state message.
The Kafka Streams panel only reads the visible HealthEndpoint result; it does not query Kafka brokers directly or bypass Health endpoint detail visibility.
For local development with an authenticated Control Panel, authenticated Health details can be shown to authenticated users:
endpoints.health.details-visible=AUTHENTICATEDendpoints:
health:
details-visible: AUTHENTICATEDendpoints = {health = {details-visible = "AUTHENTICATED"}}endpoints {
health {
detailsVisible = "AUTHENTICATED"
}
}{
endpoints {
health {
details-visible = "AUTHENTICATED"
}
}
}{
"endpoints": {
"health": {
"details-visible": "AUTHENTICATED"
}
}
}If the Control Panel itself is intentionally anonymous in a trusted local environment, use ANONYMOUS instead.
Only expose anonymous Health details in development or another trusted environment-specific configuration.
The runtime-state section is intended for quick development diagnostics and is not a replacement for Micrometer metrics, consumer lag monitoring, or a full Kafka monitoring product.
5 Creating Custom Control Panels
You can add your own control panels to the Control Panel UI. Creating custom panels requires the following:
-
An implementation of the ControlPanel interface.
-
Some configuration values.
-
The views.
The Control Panel UI follows the shadcn/ui component and dashboard design language. The runtime UI is server-rendered with Micronaut Views and Handlebars templates, with local CSS and JavaScript assets implementing the component behavior.
When creating custom control panel views, follow these conventions:
-
Use the existing card, button, badge, dialog, table, tabs, breadcrumb, sidebar, hover-card, and action-menu classes before adding new styling.
-
Use semantic CSS tokens from the bundled stylesheet instead of hard-coded colors, so the view works in light and dark modes.
-
Keep detail pages card-based, place destructive actions behind confirmation dialogs, and use action menus for table row actions.
-
Use searchable data tables for large or filterable lists.
-
Keep custom markup accessible with semantic buttons and links, labels for icon-only controls, keyboard-reachable dialogs and menus, and readable contrast in both color themes.
-
Use icons from the bundled Font Awesome assets when an icon is needed.
The categories are used to group the control panels in the UI. Categories are rendered as left side menu items. There is
a default category called Dashboard that is used for all control panels that don’t specify a category.
Control Panel Implementation
The easiest way to implement a custom panel is to extend from AbstractControlPanel. For example:
@Singleton
public class MyApplicationControlPanel extends AbstractControlPanel<MyApplicationControlPanel.Body> { // (1)

    private static final String NAME = "my-application"; // (2)

    public MyApplicationControlPanel(@Named(NAME) ControlPanelConfiguration configuration) {
        super(NAME, configuration); // (3)
    }

    @Override
    public Body getBody() {
        return new Body("This is an application-provided control panel. This text is coming from the body.");
    }

    @Override
    public Category getCategory() {
        return new Category(NAME, "My Application", "fas fa-copy", 1); // (4)
    }

    @ReflectiveAccess // (5)
    public record Body(String text){}
}| 1 | The type parameter indicates the object type of the body. You can use your own classes or records to return custom data to the view. |
| 2 | Unique name for your control panel. This is used for the configuration properties prefix. In this case:
micronaut.control-panel.panels.my-application. |
| 3 | Call the parent constructor. You can inject any other beans in this constructor. |
| 4 | The category under which the control panel will be displayed, if other than the default. |
| 5 | Use @ReflectiveAccess for GraalVM Native Image compatibility. |
Check the ControlPanel interface to see the other methods that can be overridden, for example, to display a badge in the control panel header.
Configuration
There are some values for the UI that can be configured:
micronaut.metrics.enabled=true
micronaut.control-panel.panels.my-application.title=My Application Control Panel
micronaut.control-panel.panels.my-application.icon=fa-plug
micronaut.control-panel.panels.my-application.order=10
micronaut:
metrics:
enabled: true
control-panel:
panels:
my-application:
title: My Application Control Panel # (1)
icon: fa-plug # (2)
order: 10 # (3)micronaut = {metrics = {enabled = true}, control-panel = {panels = {my-application = {title = "My Application Control Panel", icon = "fa-plug", order = 10}}}}micronaut {
metrics {
enabled = true
}
controlPanel {
panels {
myApplication {
title = "My Application Control Panel"
icon = "fa-plug"
order = 10
}
}
}
}{
micronaut {
metrics {
enabled = true
}
control-panel {
panels {
my-application {
title = "My Application Control Panel"
icon = "fa-plug"
order = 10
}
}
}
}
}{
"micronaut": {
"metrics": {
"enabled": true
},
"control-panel": {
"panels": {
"my-application": {
"title": "My Application Control Panel",
"icon": "fa-plug",
"order": 10
}
}
}
}
}| 1 | Title to be displayed in the control panel header. |
| 2 | Icon class (from Font Awesome) of the control panel. |
| 3 | The order in which the control panel will be displayed in the UI. |
Views
For rendering the views, the Control Panel uses Micronaut Views with Handlebars.java templates.
Each control panel needs to provide two views: one for the control panel list, that can contain a summary of the
information to be displayed, and another one for the detailed view. They must be placed in a views/<panel-name> directory
on the classpath, and named body.hbs and detail.hbs, respectively. For example, in the above example:
src/main/resources/views/my-application/body.hbs.<p class="card-text">
This is the body of the application-provided control panel
</p>The ControlPanel instance (MyApplicationControlPanel in this case) is stored on the Handlebars
context, so you can implicitly access its methods and properties. For example, to access the badge:
src/main/resources/views/my-application/body.hbs.{{#with controlPanel.body }}
<p class="card-text">
{{beanDefinitionsCount}} bean definitions active.
</p>
{{/with}}In the case of the detail view, the control panel instance is passed as an implicit controlPanel variable. For example,
to access the body of our control panel example:
src/main/resources/views/my-application/detail.hbs.<div class="card card-light">
<div class="card-header">
<h3 class="card-title">Details</h3>
</div>
<div class="card-body">
{{ controlPanel.body.text }}
</div>
</div>6 Repository
You can find the source code of this project in this repository: